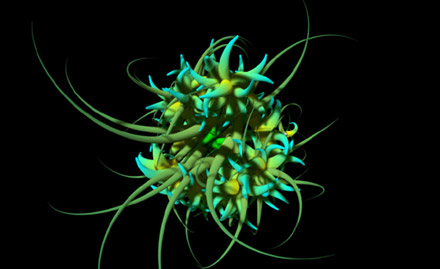
What do you see when you stare at samples of mapping and visualization (http://www.visualcomplexity.com, http://asiber.ifs.hr/galerija_virusa_en.html)?Do you see an object that has been magnified thousands of times so that now it can be properly viewed? A series of network relations highlighted to answer a number of ad hoc questions about a specific phenomenon? A purely aesthetic object, whose resemblance to the real substance is only imagined? Mapping and visualization are two distinct methods used to study the dynamics and behavior of networked phenomena (mapping) and the physical or inherent characteristics of a variety of organisms (visualization). They selectively represent and augment the physical appearance, the characteristics and the behavior of substances that are perceived as immaterial and invisible (like microscopic organisms), or phenomena whose complexity requires an operation of abstraction and simplification in order to be studied (like the dynamics of complex networks).

In order to be able to examine aspects that cannot be visible to the naked eye, or that cannot be grasped because of their intricacy, description and data analysis appear to be insufficient. Thus, visualization and mapping are forced to assign these entities an evocative appearance, or a tangible body. By selectively materializing the object, visual representation becomes a special lens onto the world. However, it doesn’t just clarify or magnify its research objects, but it filters the components and configurations of the minuscule and the nanoscale, and reveals to the lay public only the most important features necessary to the understanding of these phenomena. Because of these filtering and selective qualities, visualization and mapping can be understood as particular forms of simulation.
Shelley Turkle, talking about simulation, defines it as a process that “brings new ways to see and forget.” This statement calls for different interpretations. On one hand, we can say that the process of simulation used in visualization and mapping simultaneously magnifies (to see) and hides/reifies (to forget) its objects of research. In fact, these two methods function by creating an object out of immaterial data and by zooming into it to reveal some specific features it manifests. In addition, they do so through multiple filters: layers of technological instruments (microscopes), software (data mining software, webcrawlers, algorithms etc..) aesthetic enhancements (3D graphics, modeling) etc… Finally, they put the object through the judgment and discussion of a number of practitioners and scientists who make decisions on the object’s appearance, which reflects their goals and their audience.
On the other hand, one can also say that visualization and mapping neither hide nor reveal the object: rather, they simultaneously hide and reveal, cover and uncover, never quite accomplishing one or the other task. I would go even further: don’t the multiple decisions and forces involved end up transforming the object? In fact, the technologies engaged in the practice of visualization naturally blur the lines between the phenomenon and its simulation, the object and its aestheticized visible form. The object becomes something that is neither real, nor completely artificial. It is turned into an in-between object, one that is simulated but and that yet it looks plausible to most viewers, as their cultural and aesthetic expectations (dictated by cultural assumptions or professional inclinations) are satisfied by such appearance. This makes the final object—the one we see in science magazines or in specialized journals—a dynamic hybrid rather than just a fixed, finished and immanent product, because it stands for both the object in itself (or what we imagine it to be) and its simulation; a point of convergence of many forces; an aesthetic object; a scientifically sound document; biology and informatics fused together.
If the products of visualization and mapping can evoke as many interpretations as our perspectives as observers, then where do we find the “original object”? Or is there a specific, unique object to be found? Frankly, it would be useless to try and discern what is left of it. Why not reflect on its processual quintessence then, and on the many facets that form it?
Two elements come to mind: first, the variety of technologies available creates different professional figures specialized in dealing with different phases of visualization and the mapping process. Every time we observe a picture or a map, we stand in front of a puzzle pieced together by the individuals who have collaborated and added their professional, and culturally-specific contribution to that image. While we can imagine the presence of different voices, we can’t distinguish them. They have dissolved into, and become part of the object.
Second, The distinction between what is biological and what is informational is increasingly converging, to the extent that we can no longer separate the two realms. The calculability and sharpness of software-processed data deriving from organic material make the object look “real.” However, the more real the object looks, the more layers of technologies have been used, and, thus the more the object has been subjected to abstraction and re-elaboration.
With the mediation of computer interface, we have to come to term with a different reality. Advanced computation has given us access to–literally— bottomless amounts of resources. The viewer is gradually used to coping with objects that are neither digital, nor biological, but both. This leaves us no other option but to come to term with the fact that what counts as Nature with capital N is forever broken. Thus, we may witness a much deeper shift that sees objects not as finished products but as processes in themselves.
Roberta Buiani
D’ARS year 50/nr 203/september 2010

